Comparison Between Different Types of Speech
The corpus contains two types of speeches. In the chart below, the "Inaugurals" are represented by purple bars and the "State of the Union (SoTU)" are represented by orange bars.
The topic percentages are weighted in two ways. First, topic modeling output provides a percentage of which topic the unit of text belongs to. Second, each unit of text is weighted by the total word count in the unit. The following steps were used, for each speech type, to generate the chart above:
- At the unit of text level (each paragraph):
- Sum of all percentage per "super-topic"
- Word count of the paragraph multiplied to the sum
- At the corpus level:
- Sum of all the weighted word count from each paragraph
- Use the sum and divide by total word count throughout corpus
With the constant caveat that this is based on a limited corpus, it is not possible to say that different topics were represented in the two types of speeches. However, the results above do show some difference for the speeches in this corpus. The difference is most striking for the "Economy" topic at approximately 12.55% and least obvious for the "Law" topic at only 1.36%.
Comparison Between Presidents
The corpus contains the speeches of 8 presidents. In the charts below, each super-topic is represented by a different color as follows: "War/Peace"; "Economy"; "Law"; "Sovereignty".
The topic percentages were determined in a very similar method to the type of speech comparison seen above. As can be see from the pie charts above, there are fairly large differences in which topics were prominent for which president.
It's perhaps not surprising that 60.5% of FDR's speeches were considered "War/Peace" topic, with a large portion of his time in office during WWII. Similarly, it is not too surprising to see 52.02% of Obama's speeches focused on "Economy" as he took office during the economic crisis of '08. One of the issues revealed after generating these pie charts is regarding the unused topic (represented in grey). During the process of grouping topics into super-topics, topic 2 was disregarded because it seems to mostly be greetings and salutations. This might be a fair assumption for Cleveland's corpus when it only represent 1.45% of his speeches. However, for Nixon's corpus, it represent a very substantial 12.25%.
One possible way to ameliorate this problem is to use the 25-topic results before grouping them into super-topics. This way the "greetings and salutations" topic would possibly be seperated out more from the rest of the topics and represent its percentages in the corpus better.
The "Sovereignty" (in orange) super-topic also shows some change over time based on the pie charts. The earlier presidents have approximately 20% of their speeches in this category, while the latter half have less than 10%, with Nixon and Obama having less than 5% in this topic. The "Economy" (in purple) super-topic shows, somewhat, of the opposite trend.
Comparison Through Time
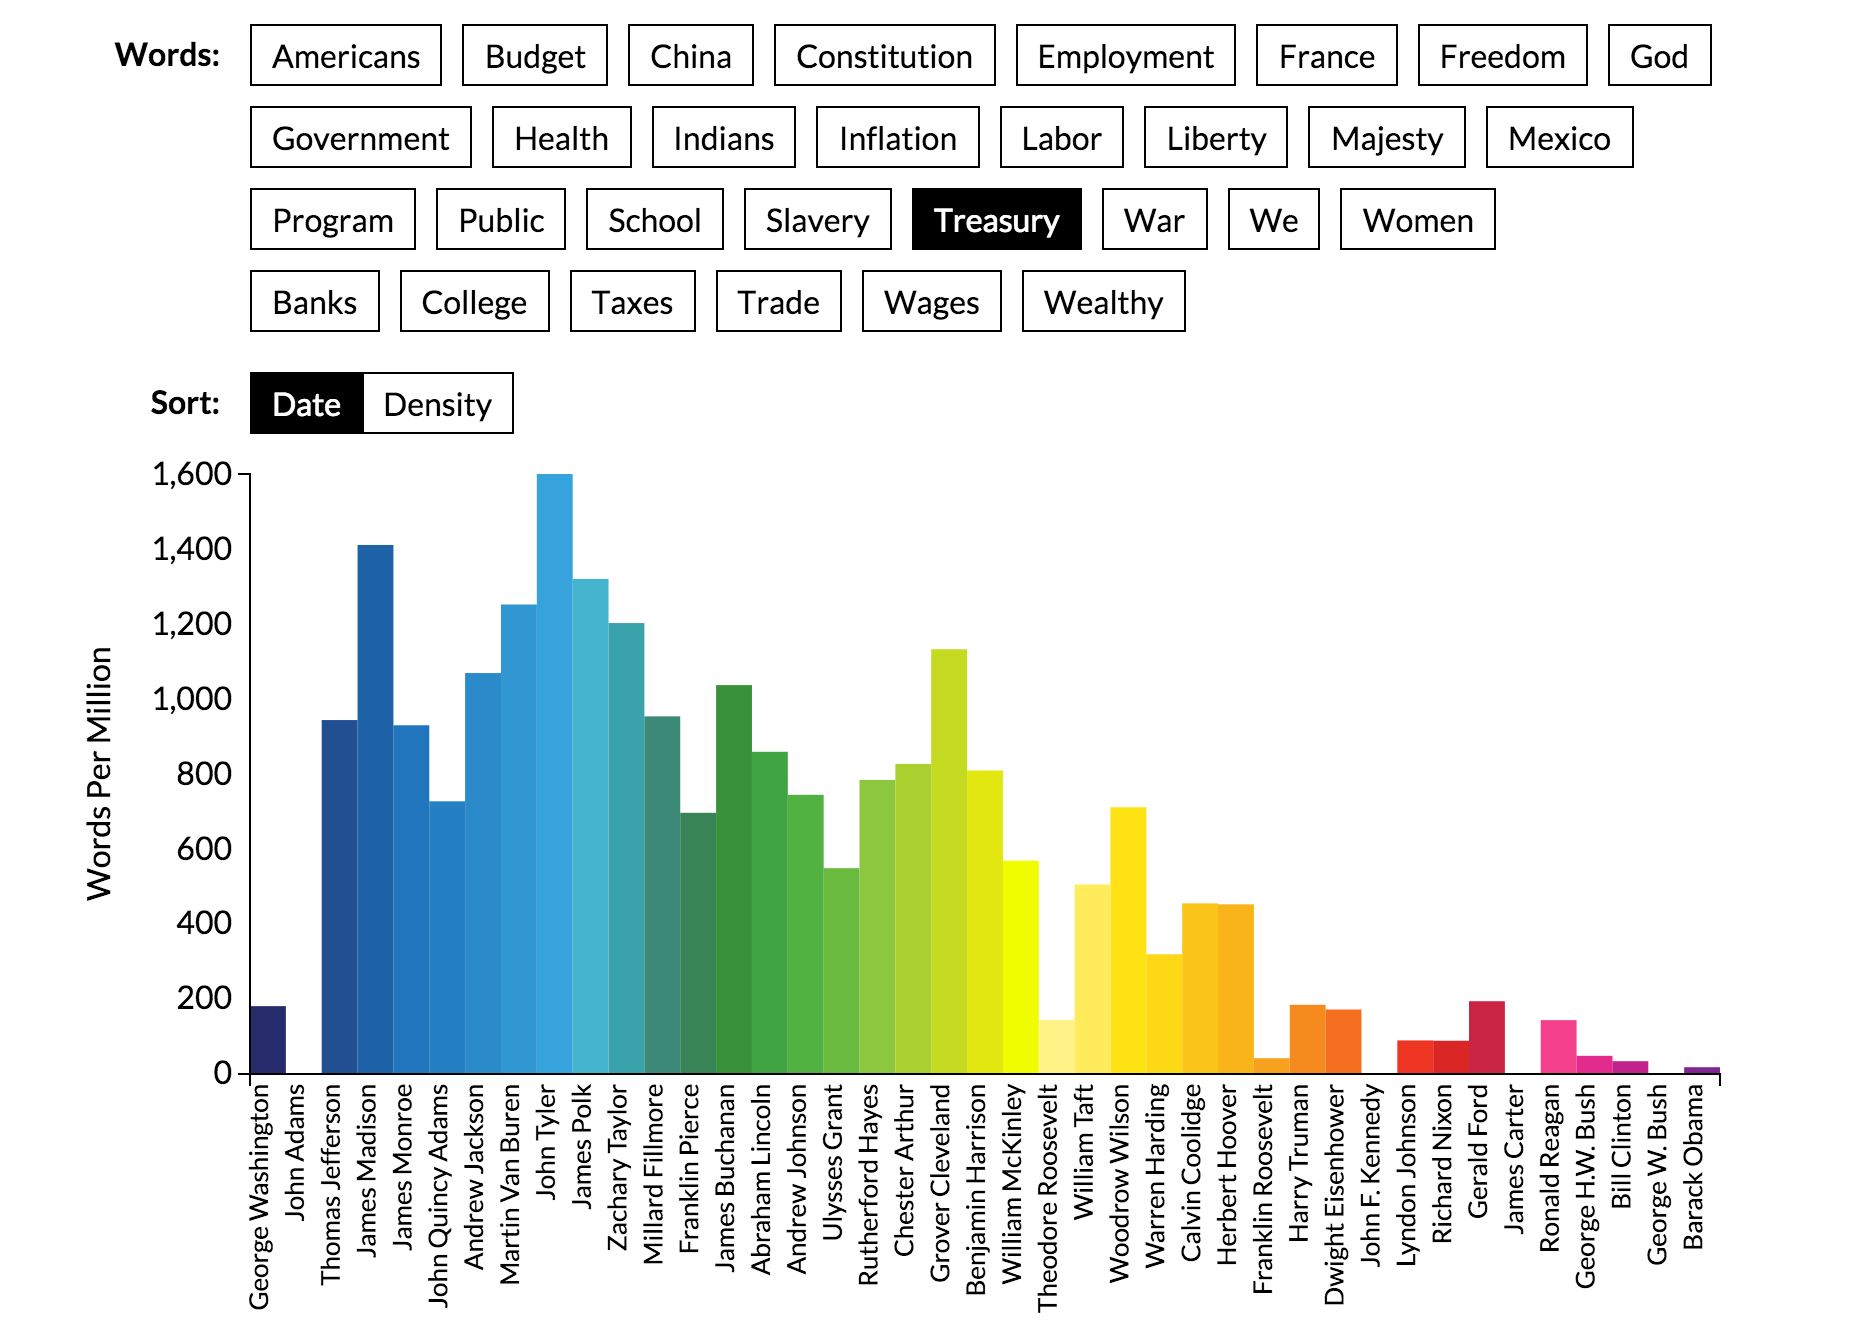
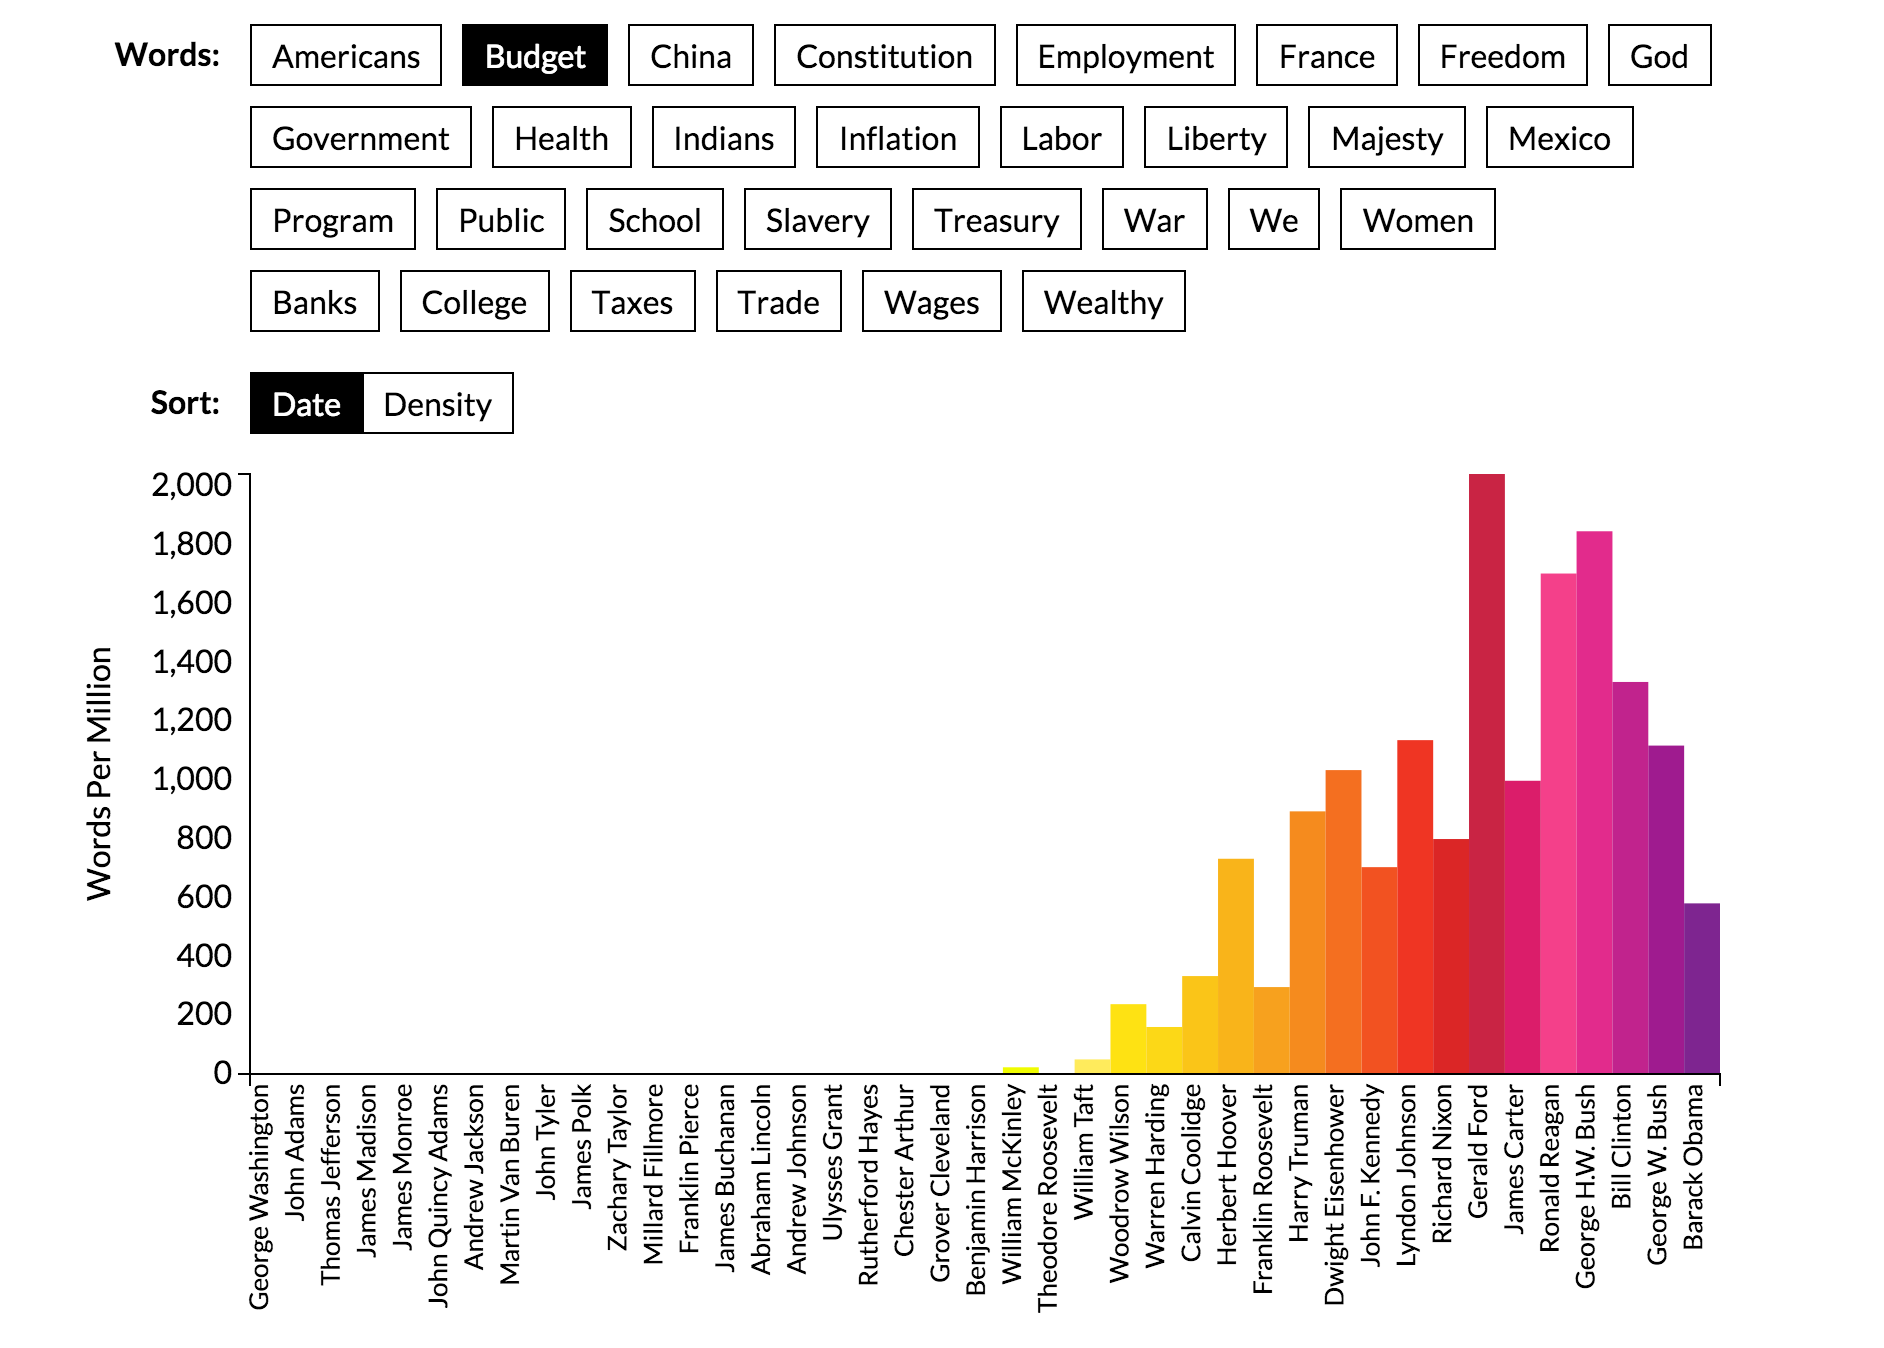
When analysing the results of topic modeling, it was initially somewhat baffling why certain key words were grouped into different topics. It was only after taking "time" into account, that this became easier to understand. This concept was well demonstrated in the article, The Language of the State of the Union by Benjamin Schmidt and Mitch Fraas in The Atlantic. Although in their interactive chart, they were graphing words rather than topics, the concept is the same. In two examples of their chart below, by selecting the words "Treasury" or "Budget", it shows when they are most frequently used.


A similar pattern could be seen when looking at topics. For example, at 14 topics, topics 7 and 8 both concern "money" matters. Here are the key words:
| Topic # | Key Words |
|---|---|
| 7 | year wa fiscal expenditure revenue june silver number treasury total increase pension government amount receipt day cent sum money |
| 8 | job american year tax business work ve family make time reform million home school economy tonight america back deficit |
Topic 7, with key words like "treasury" and "expenditure" were consistently marked for speeches from earlier parts of the corpus. While topic 8, with key words like "economy" and "tax" were more consistently marked for speeches from latter parts of the corpus.